

The microtunneling market size for 2025 comes out somewhere between about USD 0.7 billion and USD 3.8 billion depending on which report you read, and the reason is that three different markets share one name: machine sales, trenchless services, and full project spend. This article places the verified published scopes side by side, breaks each one down by method, application, diameter, end user and region, explains the drivers and the restraints behind the growth, and ends with the distinction owners and bidders most often miss, that a market size is not a unit price.
What is the microtunneling market size worth when the published reports disagree so widely?
Any single figure for the microtunneling market size is an answer to a question that was not asked. The most defensible way to read the data is as a range: for 2025 the published valuations run from about USD 0.7 billion to USD 3.8 billion, and for 2034 to 2035 the forecasts run from about USD 1.5 billion to USD 6.7 billion. The reports are not really contradicting each other; they are describing different things.
The gap is not a data error. It is the visible edge of three overlapping scopes that share one word: equipment sales, contracted services, and the full spend on completed crossings. Read the scope note before the number, and the spread starts to look orderly rather than chaotic.
Why published estimates disagree: three different markets share one name
Why do machine sales, services and full project spend give different totals?
Start with the services scope. A published study by Growth Market Reports sizes the trenchless microtunneling services market at USD 2.65 billion in 2024, rising to USD 5.04 billion by 2033, a CAGR of 7.3 percent across the 2025 to 2033 window. That number counts contracted trenchless work, not the machines that carry it out.
The equipment scope tells a different story. In the same publisher’s updated equipment study, the microtunneling machine market is put at USD 1.53 billion in 2025 growing to USD 2.96 billion by 2034, a CAGR of 7.8 percent over 2026 to 2034. A wider equipment scope from Dataintelo sizes the microtunneling machine market at USD 3.8 billion in 2025 against USD 6.7 billion in 2034 at a CAGR of 6.5 percent. Same category, two very different totals.
Full project spend is the widest scope of the three. It folds equipment, services, shafts, pipe, reinstatement and owner costs into one programme number, so it is the figure a utility board sees but never the figure an analyst publishes as a market.
How much does the base year move the number?
Base year and forecast window do the rest of the work. A study anchored on 2024 and a study anchored on 2025 will not agree even when they measure the same thing, and a nine-year window and a ten-year window compound at different rates. That is why the honest version of the microtunneling market size is a range and never a point.
Across the public material, the common compound growth rates for these scopes cluster between about 6.5 percent and 9.8 percent. When a headline rate sits outside that band, check the base year, the currency treatment and the geographic coverage before using it.
Which published estimate should you actually use?
Which published estimate should an owner quote in a business case?
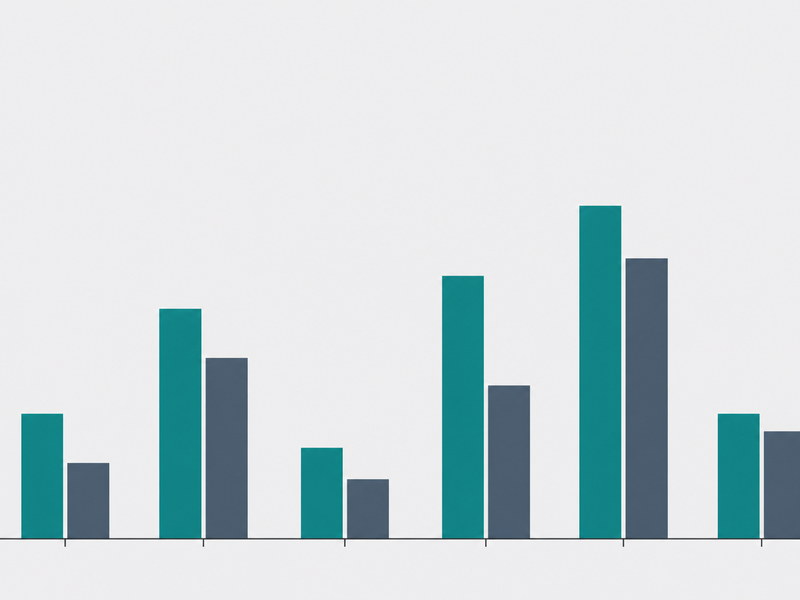
The table below places the verified estimates next to the scope each one actually measures. It is deliberately a comparison of scopes rather than a ranking, because no single row is more correct than another; each answers a different question.
The estimates below sit inside a wider trenchless technology market, and the adjacent pipe-rehabilitation segment is a useful contrast. A separate source sizes trenchless pipe rehabilitation at about USD 5.19 billion in 2026 rising to about USD 7.7 billion in 2034 at a compound growth rate of 5.05 percent, while another puts the same segment at about USD 5.3 billion in 2026 against about USD 7.6 billion in 2033 at a compound growth rate of about 5.2 percent. Those numbers describe renewal of existing pipe rather than new-build microtunneling, so they belong beside the microtunneling market size, not inside it.
| Scope measured | Base or current value | Forecast value | CAGR and window | Source (plain text) |
|---|---|---|---|---|
| Equipment sales, narrow scope | USD 1.53 billion (2025) | USD 2.96 billion (2034) | 7.8% (2026–2034) | Growth Market Reports |
| Equipment sales, wide scope | USD 3.8 billion (2025) | USD 6.7 billion (2034) | 6.5% | Dataintelo |
| Trenchless services | USD 2.65 billion (2024) | USD 5.04 billion (2033) | 7.3% (2025–2033) | Growth Market Reports |
Across every published scope, the totals run from about USD 0.7 to 3.8 billion for 2025 and from about USD 1.5 to 6.7 billion for 2034 to 2035, with growth commonly between 6.5 and 9.8 percent. That band, not any single row, is the honest version of the market for microtunneling.
How does the market break down by method, application and region?
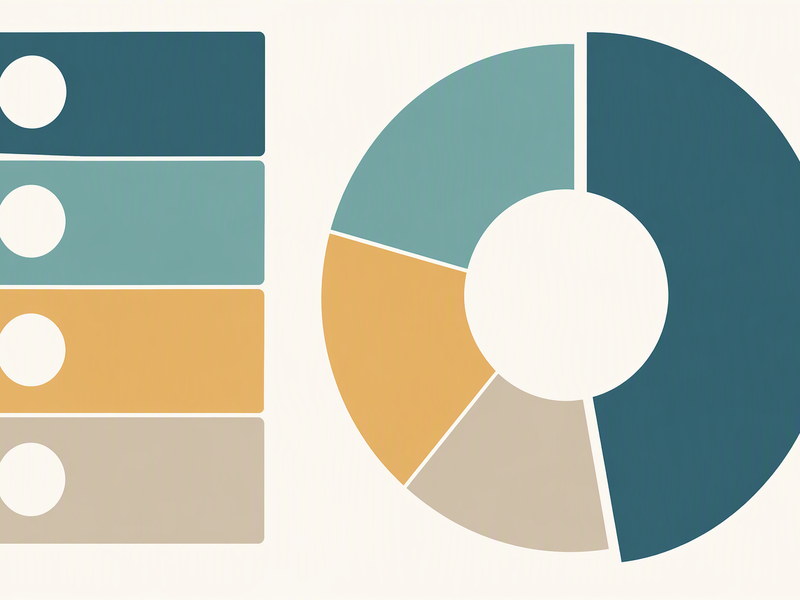
Each scope splits along its own axis, and the splits matter more than the headline total for anyone making a commercial decision. Method, application, diameter, end user and region are the five axes a bidder usually needs, and the verified picture is consistent across them.
| Dimension | Largest share or main split | Growth segments or notes | Scope |
|---|---|---|---|
| Method | Pipe jacking holds the largest share | Machine split: slurry about 54.5%, EPB about 33.5%, others about 12% | Services and equipment |
| Application | Water and wastewater is the largest | Telecommunications and electric power and energy are the growth segments | Serviços |
| Diameter | Bands of <1 m, 1–2 m and >2 m | Machine bands of <500 mm, 500–1,000 mm and >1,000 mm | Services and equipment |
| End user | Municipal is the largest | Industrial, commercial and others follow | Serviços |
| Region | Asia-Pacific about 48% | North America mature; Europe regulation-driven; Middle East and Latin America emerging | Equipment |
What is driving growth in the microtunneling market?
Demand is not uniform, and it is not evenly spread between scopes. In our bid reviews the strongest pull comes from municipal renewal programmes, where an ageing water and wastewater infrastructure can no longer be closed for open excavation. Urbanisation, extreme-weather and climate-resilience spending, and combined sewer overflow control all point the same way.
On the utility side, fibre and 5G deployment, grid undergrounding and smart-grid upgrades push the broader trenchless technology market forward, because a duct bank or conduit can be installed beneath a live corridor without shutting it. A regulatory framework that favours trenchless methods over open cuts reinforces the direction of travel. Where a region is building out water and wastewater infrastructure and modernising its grid at the same time, the trenchless technology market there tends to grow faster than either driver alone would suggest.
- Network renewal: replacing water and wastewater infrastructure built decades ago, where surface disruption is no longer acceptable.
- Urban intensification: more services under busier streets, with less room for open trench and traffic management.
- Climate resilience: overflow control and flood-relief capacity pushing large crossings onto trenchless methods.
- Digital build-out: fibre, 5G, grid undergrounding and smart-grid work adding conduit and cable crossings.
Technology has stretched the envelope as well. Published industry figures show the longest North American drive growing from 475 m in 1989 to 930 m by 2008, with more than 1,000 m now common, and the largest-diameter record reached a 3.4 m internal diameter in Canada, completed in December 2022 over a 765 m length. Both trends widen the addressable project list before demand even grows.
Which restraint on the microtunneling market binds first?
The restraints are practical rather than technical, and they slow a programme long before the cutting head turns. In our experience the binding constraint is rarely the machine; it is the number of crews that can run one safely and the time it takes to secure a shaft site and its permits.
- Skilled labour: the pool of experienced microtunneling crews and specialist contractors is limited.
- Capital intensity: machines and slurry separation plants need heavy upfront investment.
- Bid risk: ground uncertainty can turn a competitive bid into a loss without careful risk pricing.
- Permits and land: shaft acquisition and permitting timelines can exceed the drive duration itself.
Where is the next decade of microtunneling volume likely to sit?
Which region should an owner plan a microtunneling programme around?
Asia-Pacific carries the largest share, at about 48 percent of the machine market in the published equipment scope, and it is also the fastest-growing region. That concentration matters when a supplier sizes a factory or a bidder plans a campaign around a region.
North America is a mature market whose volume is dominated by water and wastewater renewal. Europe is steady and regulation-driven, with environmental rules doing much of the work that demand would otherwise have to do. The Middle East and Latin America are smaller but growing emerging markets, often tied to large municipal programmes.
What does a market total not tell you about the cost of one crossing?
A market size is not a price, and confusing the two is the most common error in early-stage budgeting. Public US contractor and municipal planning material puts microtunneling unit cost at about USD 55 to USD 95 per foot per inch of diameter, while a large municipal cost-criterion memo cites about USD 35 to USD 75 per foot. Both are public ranges, and neither is a quotation.
A microtunneling market size number sits at the top of a study; the unit cost sits at the project, and the two are not interchangeable. Diameter, ground, depth, shaft cost and mobilisation decide the real number, which is why the same machine on the same length can cost a multiple of a published average once the ground stops behaving. The table below shows how sharply that variable bites when a trenchless method is compared with open cut.
| Comparison | Excavation per metre | Truck trips per 100 m | Carbon dioxide |
|---|---|---|---|
| 760 mm pipe jacking vs 1,400 mm open cut | 0.5 m³ vs 6.1 m³ | 8 vs 136 | 27.1 t vs 66.7 t |
| 1,450 mm pipe jacking vs 2,350 mm trench | 1.65 m³ vs 10.28 m³ | 21 vs 220 | 69.7 t vs 110.6 t |

Carbon reduction of up to 75 percent across these comparisons is a project-level benefit, not a market price. Our field teams use the same logic when they price: the market number sets the neighbourhood, and the site sets the number.
How should an owner use a published market forecast in an early-stage budget?
Treat a published market forecast as a bracket, not a budget. The fastest way to use one correctly is to match the scope to the decision in front of you, then adjust for region and application before it reaches a spreadsheet.
- Match the scope to the decision: equipment demand needs the machine scope, contracting capacity needs the services scope, programme funding needs full project spend.
- Adjust for region and application: an Asia-Pacific growth rate does not transfer automatically to a mature North-American renewal programme.
- Never carry a market total into a budget: build the estimate from diameter, ground, depth and shafts, then sanity-check it against the published unit range.
- Check the base year and window: a figure without both is not usable in a comparison.
A single microtunneling market size number can describe equipment demand, contract activity or programme funding, and only one of those usually matters to the decision at hand. In our bid reviews, the teams that use these numbers well do one thing differently. They quote the range and the scope in the same sentence, so nobody downstream can mistake a market total for a price. On programmes we have supported, that single habit removed most of the confusion a published forecast can create.
Microtunneling market size: frequently asked questions (FAQ)
Why do microtunneling market size estimates disagree so much?
Because the reports measure different things under the same name. A machine study counts equipment sales, a services study counts contracted trenchless work, and a project-spend figure counts everything a utility pays for a completed crossing. Scope, base year and geography explain most of the spread.
What is the difference between the machine market and the services market?
The machine market counts equipment, while the services market counts construction. Sales of microtunneling machines and their major components sit in one scope, and the trenchless contracts that use them sit in the other. They grow at different rates and answer different questions.
Which region is the largest market for microtunneling machines?
Asia-Pacific is the largest and fastest-growing region in the machine scope. It is about 48 percent of the published equipment market. North America and Europe remain large but more mature, and the Middle East and Latin America are smaller emerging markets.
Which end-use application is the largest in the services market?
Water and wastewater is the largest application in the services scope. Telecommunications and electric power and energy are the growth segments behind it, and municipal owners are the largest end-user group, ahead of industrial and commercial buyers.
What is holding the microtunneling market back?
The restraints are practical rather than technical, and the first one to bite is usually people. A second machine can be bought in months, while a second experienced shift takes years to build, so crew supply, not capital, is what sets the pace of a programme.
Does a market forecast tell me what a microtunneling project will cost?
No, a market forecast is not a price. It describes total spending across a region or segment, not the cost of one crossing. Unit cost depends on diameter, ground, depth, shafts and mobilisation, so a published dollars-per-foot range is a planning reference, not a quotation.
Key takeaways
- Published estimates disagree because three markets share one name: equipment sales, trenchless services and full project spend.
- The equipment and services scopes both grow in the mid-single digits to high single digits, but they measure different things.
- Scope, base year and geography move the total far more than any single growth rate.
- Asia-Pacific is about 48 percent of the machine market and the fastest-growing region.
- A market size is not a unit price; unit cost tracks diameter, ground, depth and shafts, not the headline total.
How JSW supports microtunneling programmes
JSW is a pipeline engineering and construction company that delivers trenchless crossings with its own crews and equipment. Our scope covers microtunneling construction, trenchless technologies, serviços de instalação de condutas, pipeline repair services e pipeline inspection service.
Our capability covers microtunneling installation from DN300 to DN1500 (12 to 60 in.), drive lengths up to 600 m, laser guidance to about plus or minus 25 mm, and depths of roughly 2 to 25 m in ground from soft clay to hard rock near 80 MPa UCS. Long drives use interjack stations at roughly every 100 to 150 m, and our management systems hold ISO 9001:2015, ISO 14001:2015 and ISO 45001:2018. Reading the microtunneling market size correctly is a planning skill, not a purchasing decision.
- Scope-matched estimating: equipment, services and full programme spend are quoted in separate columns, each traceable to the scope it measures.
- Auditable process data: guidance, jacking force and grout records are kept for review after the drive.
- Risk-explicit pricing: ground, utility and permitting risk are named in the bid rather than carried as a hidden rate.
- Safety and compliance: certified management systems under ISO 9001:2015, ISO 14001:2015 and ISO 45001:2018.
Planning a microtunneling programme and need a real cost signal? Send your alignment, diameter and geotechnical summary for a free technical review. Our engineers respond with a scoped recommendation and a budget range.











 English
  Arabic
  Russian
  Spanish
  French
  Vietnamese
  Polish
  Thai
Thai  Indonesian
  Turkish
  Portuguese