
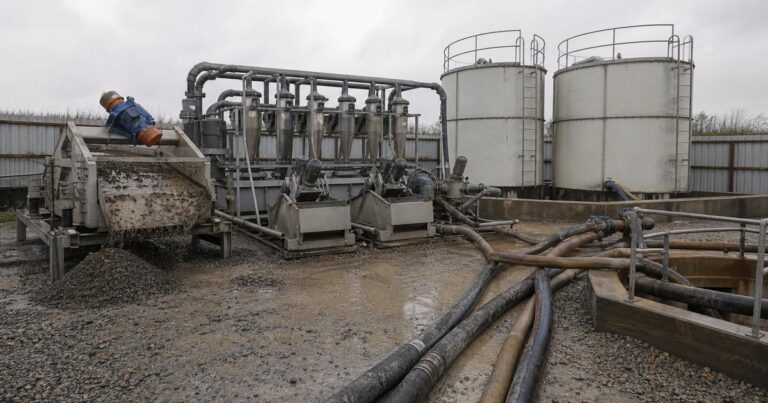
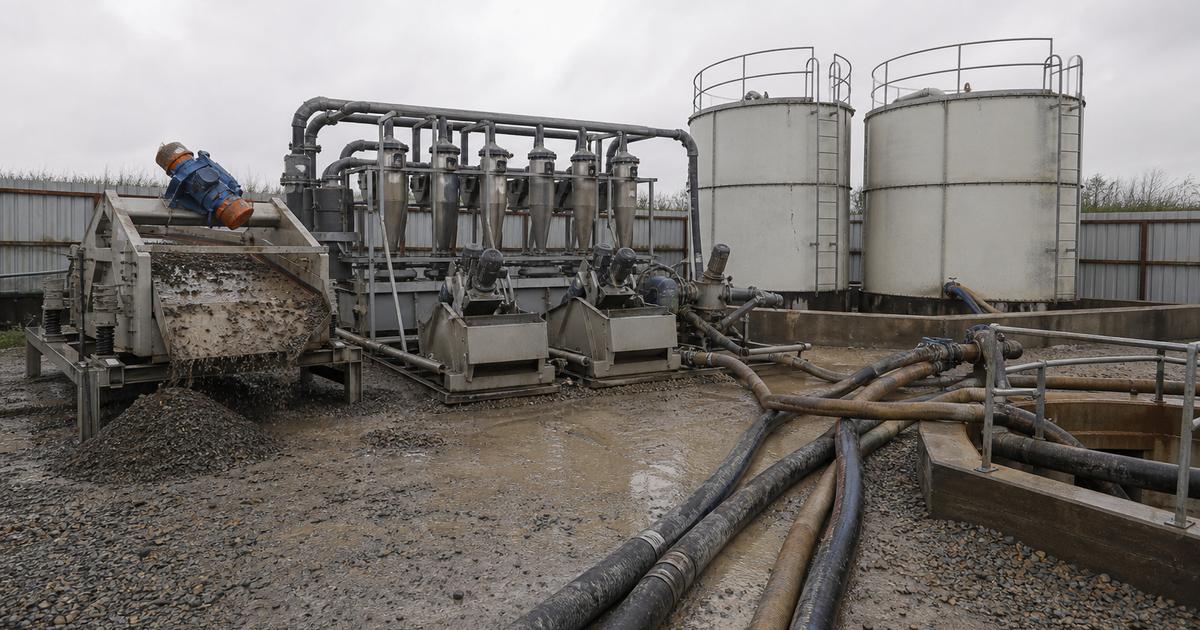
A slurry separation plant sets the maximum sustainable advance rate of a microtunneling drive: the machine can only advance as fast as the plant removes solids. It removes excavated solids in stages defined by particle size, conditions the slurry back to its working density and viscosity, and returns it to the face. If it cannot process material as fast as the cutterhead cuts it, the machine slows until the two match. This guide shows how the plant is sized from the excavation, which stage removes which band, what bottlenecks throughput, and where the cost sits.
This guide covers how a slurry separation plant is sized, the inputs that control the calculation, the separation stages and the particle size each one removes, the four components that in practice become the bottleneck, how to keep slurry density inside the working window, how an undersized plant announces itself in the field, and where the cost actually sits when the plant is specified line by line.
What Does a Slurry Separation Plant Have to Do?
A slurry separation plant has to remove excavated solids from the circulating slurry faster than the machine produces them, while holding slurry density, viscosity and solids content inside the window the face support system depends on. It performs four functions at once: separating solids from the excavation fluid, maintaining fluid properties, maintaining production without stopping the machine, and meeting the environmental and disposal requirements for the spoil and water it produces.
Those four functions interact, which is why sizing cannot be treated as a pump-selection exercise. A plant that removes coarse material well but leaves fines in circulation will show a slow rise in solids loading in the slurry, and that rise is what eventually forces the operator to reduce the rate of progress.
How Do You Size a Slurry Separation Plant?
Sizing starts from the excavation, not from the equipment catalog.
The Seven Inputs That Size the Plant
- Excavation diameter and cross-section. Diameter sets the volume excavated per meter advanced, and therefore the solids load per meter.
- Required rate of progress. This converts the solids load into a rate of production per hour – and the plant must be sized to the peak, not the average, because ground variability produces sustained periods above the mean.
- Particle size distribution. This decides which separation stages are needed, and it is the input most often summarized as a single soil type when it should be a grading curve.
- Fines content. Fine particles stay in suspension, raise density and viscosity, hinder recirculation and increase operating cost. Fines, not gravel, decide whether a plant is adequate.
- Slurry flow rate. The plant has to treat the whole flow circulating between the machine and the surface, which depends on diameter, drive distance, head loss, pumping capacity, face pressure and the volume of material being transported.
- Pumping distance and head. Circuit length, shaft depth and pressure losses govern the pumps, the pipework and the pressures the plant sees.
- Environmental and disposal constraints. Storage, dewatering, transport, waste characterization, water reuse, available land and permits all shape the configuration.
From Advance Rate to Required Flow
To turn those inputs into a number, work the arithmetic in order. Worked illustrative example, not a design: a 760 mm outside-diameter pipe jacking drive produces of the order of 0.5 m3 of excavated volume per meter (published open-trench versus pipe-jacked comparison), so at an illustrative peak advance rate of 3 m per hour the plant must remove about 1.5 m3 of in-situ solids per hour before any margin. Add the overcut and any excavation above the nominal profile, then convert to a mass rate using the in-situ bulk density. Compare that solids load against the plant’s rated throughput at the governing cut point, the finest particle band the ground actually contains in quantity.
Size to Peak, Not Average
The most common sizing error is matching capacity to average progress rate. Published industry guidance on separation sizing recommends sizing to peak demand and adding capacity for ground variability, finer particles and operational margin, with a commonly quoted minimum of about 20% excess capacity over calculated peak excavation rate (a typical planning band, not a design value), rising where ground is unknown or highly variable. Where clay or silt dominates the fines, the same guidance suggests materially more capacity again for the same excavation rate, because fine material occupies the plant for longer.
Separation Stages and What Each One Removes
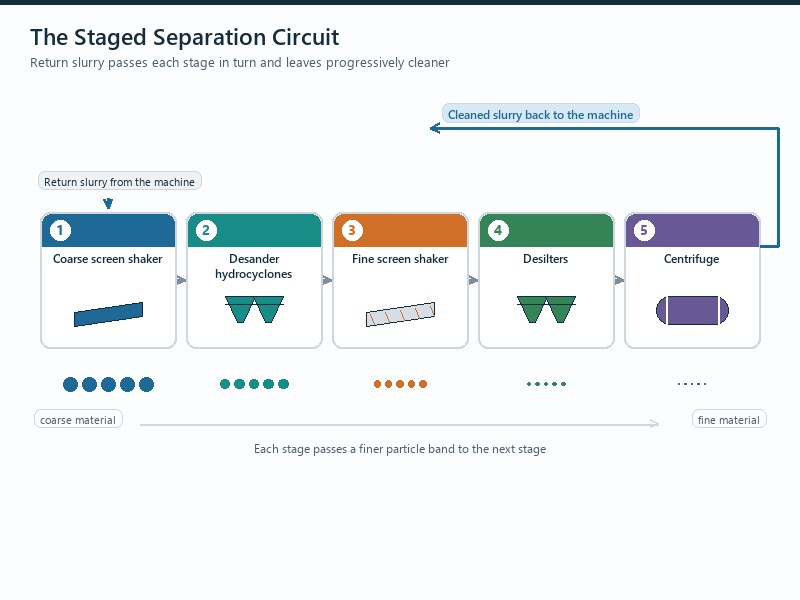
A slurry separation plant is a staged system, and each stage is defined by the particle size it can remove. The stages are cumulative: material that passes one stage is the feed for the next, so the plant’s real capability is set by the finest stage that is actually installed.
| Stage | Particle band removed | What it protects downstream |
|---|---|---|
| Coarse screen shaker (vibrating screen deck) | About 440 microns and above | Pumps, lines and hydrocyclone feed from coarse solids |
| Desander (cyclone for the sand band) | About 100 microns and above | Removes the sand fraction that causes rapid wear |
| Fine screen shaker | About 44 to 74 microns and above | Intermediate cut for finer sand and silt |
| Mud cleaner | About 44 to 77 microns and above | Combined screening and cyclone duty on the fine band |
| Desilters (small cyclones for the silt band) | About 15 microns and above | Keeps the silt fraction from building density |
| Centrifuge | About 4 to 8 microns and below | Removes colloidal fines that no screen or cyclone can take out |
Applies to: the published industry cut-point bands for screening, desanding, desilting and centrifugation, used to compare plant configurations during planning. Not applicable where: the drive’s grading curve, bore diameter and required rate of progress set a project-specific capacity – that value must be sized by the plant supplier and a competent engineer.
Not every project needs every stage. Clean sand and gravel may need only screening and desanding (removing the sand fraction with hydrocyclones); desilting, removing the silt that stays in suspension, is added where the ground contains fine silt. A drive through silt or clay usually needs desilters, and in some cases chemical treatment, centrifugation or filter-press processing. Where no mechanical plant is proposed, published specification practice allows a settling alternative: a series of weirs and storage tanks in which excavated solids settle. The tanks must then be cleaned out, and the settled material disposed of at an approved facility.
The Four Components That Actually Bottleneck a Plant
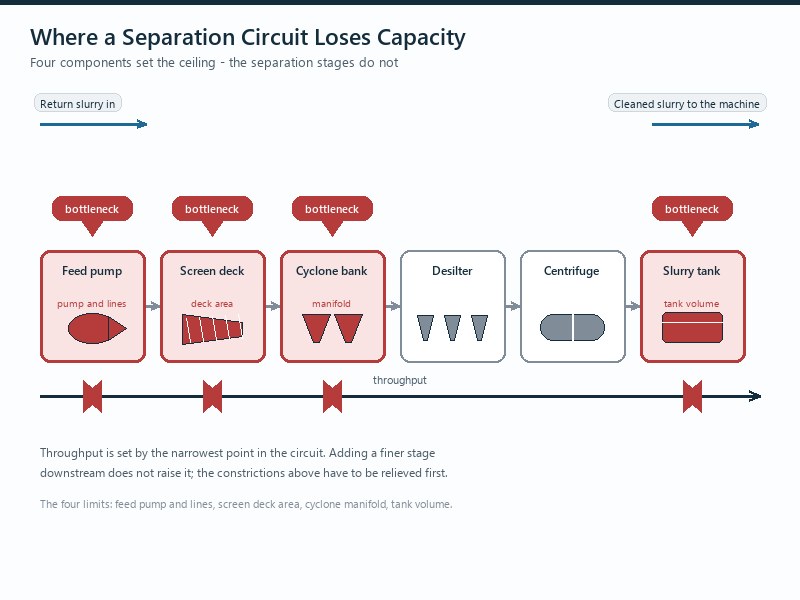
Throughput is decided by the four supporting components around the separation stages – feed pumps, hydrocyclones, vibrating screens and slurry tank volume – not by the stages alone, so the constraint is often added late or substituted to save cost.
| Component | Capacity check | Common bottleneck |
|---|---|---|
| Feed pumps | Flow rate against hydrocyclone requirement | Undersized pumps reduce cyclone efficiency even when the cones themselves are adequate |
| Hydrocyclones | Total throughput against excavation rate | Too few units, or worn cones and apexes that no longer make their cut |
| Vibrating screens | Surface area against solids volume | Blinding of the deck reduces effective area and passes oversize downstream |
| Slurry tanks | Volume against required surge capacity | Tanks too small to buffer flow variation, so the machine is paced by the circuit |
Wear is part of the same capacity problem. Crushed rock and abrasive material accelerate wear on pumps, lines, screens and hydrocyclones, so wear resistance and scheduled maintenance belong in the operating plan from the start, treated as routine upkeep rather than repairs after a failure.
The slurry line itself needs its own provision: intermediate pumps along the tunnel reach to provide the flow and pressure for active support pressure, intermediate pumps on the discharge line to remove cuttings at minimal face support pressure, and at least two abrasion-resistant pressure sensors on the feed line and two on the discharge line, replaceable under operating conditions.
Keeping Slurry Properties Inside the Working Window
The plant exists to hold slurry density, viscosity and solids inside the working window the face support system needs. On drives we have supported, the difference between a circuit that runs continuously and one that keeps stopping was almost always how early the drift in slurry density and viscosity was detected.
Monitoring: What to Log Every Shift
- Flow balance. Feed and return flow rates are the first indication that solids are accumulating or that the face circuit is losing fluid.
- Slurry density and viscosity. These are the variables that decide cuttings transport capacity and face pressure behavior.
- Solids content and separated solids grading. What the plant is actually removing, checked against the geotechnical grading curve.
- System pressure and pressure drops. Rising pressure loss along a circuit is a blockage forming, not a pump problem.
- Excavated volume against processed volume. The reconciliation that shows whether material is being removed as fast as it is cut.
- Consumption. Water, bentonite or additives, and the volume of waste generated per meter advanced.
Bottom line: a separation plant is managed by reconciliation – volume in against volume out, density against target – and a shift that ends without those numbers recorded has no way of knowing whether capacity margin was preserved or consumed.
What an Undersized Plant Looks Like in the Field
An undersized slurry separation plant rarely stops the drive outright; it degrades throughput, and that degradation is easily misattributed. The table below is the field translation of a capacity problem.
Rising slurry density during continuous advance is the clearest sign that separation capacity, not the ground, is the constraint.
| Symptom | How it is usually explained | Actual cause |
|---|---|---|
| Rising slurry density during continuous advance | Ground is denser than expected | Solids are not being removed as fast as they arrive |
| Extended circulation between pushes | Normal cleaning cycle | Catching up on accumulated solids |
| Lower advance rate in “difficult ground” | Ground conditions limiting progress | Operator reducing rate to match plant capacity |
| Frequent dilution water additions | Maintaining viscosity | Compensating for poor solids removal |
| Higher than expected bentonite consumption | Ground absorbing bentonite | Bentonite lost with overflow and replaced repeatedly |
The downstream consequences are mechanical as well as program-related. Higher solids concentration accelerates impeller and casing erosion. Degraded slurry needs more frequent conditioning. Poorly separated spoil carries more liquid to dispose of. And every day of lost advance carries standby cost for crew and plant.
Cost Drivers, Line by Line
Separation plant cost is usually quoted as a lump sum for capacity. Broken down, the cost stack looks like this.
For a bidder or contractor this stack is a pricing checklist; for an owner or EPC it is a comparison basis, because a low lump sum usually moves cost into fines handling, wear and spoil disposal rather than removing it.
- Installed capacity. Number and size of shakers, hydrocyclones and desilters, plus the pumps that feed them.
- Fines handling. Desilters, centrifuges, flocculation or filter presses, and the chemical consumables they need – the stage that most often separates a cheap plant from an adequate one.
- Wear materials. Cyclone cones, apexes, screen decks, pump impellers and casings, and lined pipework, in proportion to abrasiveness.
- Tankage and footprint. Slurry and surge tanks, settlement capacity, and the site area they occupy, which on an urban shaft site is often the binding constraint.
- Power and pumping. Energy for pumps and shakers, and the intermediate pumps needed along a long drive.
- Spoil disposal. Dewatering, transport, waste characterization and tipping, all driven by how much water is left in the separated solids.
- Water and conditioning. Make-up water, bentonite and polymers, and the cost of treating or disposing of surplus fluid.
- Mobilization and standby. Transport, craneage, setup, and the cost of the plant sitting idle when the drive stops.
Across these lines, spoil disposal is the cost that moves fastest when separation is poor, because disposal is priced on the water left in the solids – so the fines and dewatering stages are cost decisions, not only process decisions.
The economics are asymmetric in one respect that matters at specification stage: adding capacity later is more expensive than specifying it initially, and the cost of a modest capacity shortfall is paid in reduced rate of progress across the whole drive rather than in one visible line item.
Bottom line: a slurry separation plant should be specified from the excavation rate and the grading curve, with a stated margin, a defined finest cut, and the wear and disposal consequences priced in. A plant sized from an average rate and a single soil description will be the constraint on the drive, and it will not look like a fault.
Key Takeaways
- A slurry separation plant sets the maximum sustainable advance rate; the machine can only advance as fast as the plant can remove solids.
- Size to peak excavation rate, not average, with a commonly quoted minimum margin of about 20% over calculated peak.
- Each stage removes a defined particle band, from coarse screen shakers at about 440 microns to centrifuges at about 4 to 8 microns.
- Fines dictate whether a plant is adequate: they stay in suspension and raise slurry density rather than settling out.
- Feed pumps, hydrocyclones, vibrating screens and tank volume are the four components that actually bottleneck throughput.
- Rising slurry density during continuous advance is the clearest field indicator that capacity, not ground, is the constraint – and spoil disposal is the cost line that grows fastest when separation is poor.
Frequently Asked Questions
How do you size a slurry separation plant?
Size the plant against peak excavation rate, not average, then add margin for fines and ground variability. The calculation starts from tunnel diameter and required advance rate, converts that into excavated volume per meter and per hour, and then into the circulation flow the plant has to process.
What do the separation stages actually remove?
In a staged separation plant, each stage removes one particle band, from coarse to fine. Coarse screen shakers take roughly 440 microns and above, desanders about 100 microns and above, fine screen shakers about 44 to 74 microns and above, mud cleaners about 44 to 77 microns and above, desilters about 15 microns and above, and centrifuges the 4 to 8 micron band and below.
Why does fine material cause more trouble than gravel?
Because fines stay in suspension and raise density and viscosity instead of settling out. Gravel and coarse sand separate quickly with screening and desanding, but silt and clay keep recirculating, so the circuit has to be conditioned or treated chemically before the slurry can carry cuttings again.
How do I know the plant is undersized?
Rising slurry density during continuous advance is the clearest indicator. Other symptoms are extended circulation between pushes, a reduction in advance rate that gets attributed to difficult ground, frequent dilution water additions, and higher than expected bentonite consumption.
What capacity margin should be specified?
A commonly quoted starting point is at least about 20% excess capacity over calculated peak excavation rate (a typical planning value, not a design value). More capacity is needed where ground conditions are unknown or highly variable, and more again where clay or silt dominates the fines.
Which parts of the plant usually limit throughput?
Usually the feed pumps, the hydrocyclones, the vibrating screens or the slurry tank volume. Undersized pumps reduce cyclone efficiency, too few or worn hydrocyclones cannot process the flow, blinded screens lose effective area, and small tanks cannot buffer flow variation.
How JSW Supports Slurry Circuit Design and Operation
JSW is a pipeline engineering and construction company that executes trenchless crossings with its own crews and equipment. Our scope covers microtunneling construction, trenchless technologies, HDD crossing services e serviços de instalação de condutas, and we plan the slurry circuit and the separation capacity as one system with the drive rather than as a site service bolted on afterwards.
Our approach is to size from the grading curve and the peak excavation rate, then keep the circuit honest with shift-by-shift reconciliation of volume excavated against volume processed. Where the fines content makes a mechanical plant marginal, we say so at bid stage, because that conversation is far cheaper before mobilization than during a drive.
- Sizing from the excavation: capacity derived from diameter, peak advance rate, grading and fines content, with a stated margin rather than an assumed one.
- Circuit telemetry: feed and return flows, density, pressure and processed volume logged so capacity loss is detected early.
- Desanding and fines discipline: separation stages matched to the particle bands actually present in the ground, not to a generic soil description.
- Certified delivery: our trenchless work is delivered under ISO 9001:2015, ISO 14001:2015 and ISO 45001:2018 certified management systems.
Working out how much separation capacity your drive actually needs? Send your bore diameter, drive length, target advance rate and geotechnical grading for a free technical review, and our engineers respond with a scoped separation recommendation and an indicative budget range.











 English
  Arabic
  Russian
  Spanish
  French
  Vietnamese
  Polish
  Thai
Thai  Indonesian
  Turkish
  Portuguese