
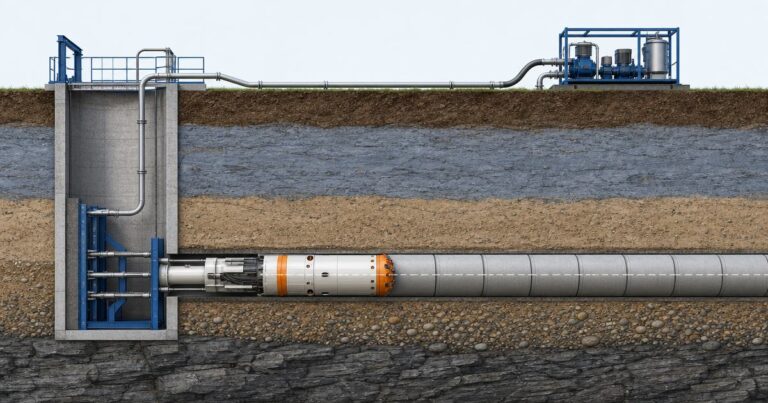
Short answer: published municipal case studies report microtunneling productivity of roughly 30-50 linear feet per day (about 9-15 m per day) on established soft-ground drives, so plan production in that band and treat it as a planning range rather than a guarantee.
Advance rates decide whether a drive finishes inside its programme. The microtunneling productivity to plan for is set by how shift cycle time is spent, why machine utilization falls short of theory, and how ground, downtime and long drives move the programme. It also compares single versus two shifts. All figures are published planning ranges, not guarantees.
What Advance Rate Should You Expect per Shift?
On established soft-ground drives, plan about 9-15 m per shift, matching the 30-50 linear feet per day reported in published municipal case studies. That is an average across good and bad days.
Plan the advance rate as a range that three variables decide. Three variables set where your drive sits inside it:
- Ground behaviour at the face – how fast the machine can cut and how much support the face needs.
- Machine utilization – the share of the shift actually spent cutting.
- Drive length and diameter – friction, jacking force and pipe handling per metre.
Bottom line: quote a range, because a fixed output figure is a planning error rather than a commitment.
Typical Advance Rates by Ground Type
If you want to know what your ground will actually allow, the range of microtunneling productivity tracks ground behaviour more than machine size. Two machines of the same class can sit at opposite ends of the published band on the same drive length.
Treat 9-15 m per day as the centre.
- Firm clay and silt – usually the fastest soil, limited by muck handling and cutterhead clogging.
- Loose sand and gravel – face support sets the pace, with slurry capacity as the limit.
- Running or water-bearing sand – slower and more variable; stability and settlement govern.
- Soft to medium rock – reduced, with tool condition as the pacing item.
- Mixed face and boulder zones – the lowest and least predictable band.

Bottom line: ground conditions explain most of the difference between two drives performing at very different rates.
What Actually Happens in a Microtunneling Shift
In a microtunneling drive – a remotely controlled, guided, face-supported pipe jacking operation, to ASCE 36-15 – a shift advances only while the cutterhead turns, and every other task on site competes with that time. Reducing the cycle time of any recurring step adds metres to the day.
| Shift activity | Share of shift time | What drives it |
|---|---|---|
| Shift start-up and checks | Fixed, small | Instrumentation, slurry and power checks |
| Cutting and jacking | The only block that adds metres | Face conditions and jacking rate |
| Pipe joint handling | Recurring, every 2-3 m | Pipe length, jacking stroke, alignment |
| Slurry and spoil handling | Continuous during cutting | Separation plant capacity and disposal |
| Lubrication and grouting | Intermittent | Lubrication programme and ground |
| Survey and steering correction | Periodic | Guidance system and tolerance |
| End-of-shift maintenance | Fixed, small | Wiper, seal and cutter inspection |
Pipe joints recur every 2-3 m, so a 150 m drive needs roughly 50 to 75 of them.

Bottom line: a shorter cycle time on pipe handling and slurry returns converts directly into advance, and is easier to attack than the cutting rate.
Machine Utilization: Why Theoretical Rates Are Never Achieved
If your programme assumes the machine cuts every minute of the shift, that is theoretical penetration. Machine utilization measures how much of that time actually happens, and the shift-cycle table above shows which activities take the rest.

In our drives, the fastest way to lift machine utilization has been to shorten the steps around the machine. Pushing the cutterhead harder has ranked behind that.
Bottom line: the working share of the shift decides most daily output, ahead of cutterhead power.
How Ground Conditions Cut the Advance Rate
Ground sets production and face support rather than stopping the drive, and both effects grow with depth and water pressure.
- Loose, water-bearing sand – full face support is required, so cutting slows while balance is held.
- Stiff clay – cuts quickly but can clog the cutterhead and muck circuit, adding stoppages.
- Boulders and obstructions – up to roughly 30 percent of the face can be handled by a cutterhead designed for it.
- Mixed face – rock and soil in one face is the hardest case, with uneven tool loading and frequent corrections.
The rate a ground condition permits is a planning input rather than a machine specification.
Bottom line: ground sets the ceiling on production; the machine only decides how close you get to it.
Diameter, Face Area and Penetration
What does a larger diameter change? More face area to cut, more spoil to move and more pipe to handle per metre. Penetration per revolution can stay the same while metres fall, because each metre removes more material.
- Cutting volume rises with the square of diameter.
- Spoil volumes, slurry demand and separation plant load rise with it.
For how diameter and depth move cost and schedule together, see what drives microtunneling cost and schedule.
Bottom line: compare advance rates only at similar diameter, because a bigger machine moves more ground with every metre.
The Downtime Drivers That Break a Programme
Why does a programme slip? Usually through many small stoppages rather than one dramatic failure.
- Cutter changes and inspection – required work, but the largest planned stop in abrasive or rock ground.
- Slurry circuit problems – blockages, pump wear and leaks stop cutting until cleared.
- Settlement limits – a stop-work trigger pauses the drive while monitoring is reviewed.
- Utility conflicts – an unmapped service on the alignment forces a hold and a re-check.
- Spoil disposal constraints – limited skip or truck capacity backs up the machine.
- Weather, noise and permit limits – night-time noise rules can end a shift early in built-up areas.
Consistent microtunneling productivity depends more on removing these interruptions than on pushing the cutterhead. Contract clauses that allocate responsibility for ground-related stops are covered in risk allocation in microtunneling contracts.
Bottom line: count the stoppages before you promise a date; the cutting rate is the smaller uncertainty.
Long Drives, Intermediate Jacking Stations and Rate Decay
Friction accumulates along a jacked pipe string. Long-distance pipe jacking is generally treated as drives from about 300 m up to 1,000 m or more, and production tends to decay as the string grows longer.
Intermediate jacking stations reset the force problem by pushing from within the string. Specifications commonly require allowance for a station roughly every 100 m on long drives. Machines in the 600-900 mm class are typically limited to 160-200 m per drive without them; how that is written is set out in writing a microtunneling specification.
- More pipe means more friction, even with effective lubrication.
- Longer drives add more pipe joints and more thrust resets.
Where lubrication is effective, unit friction on the pipe is commonly taken in the range of 2-5 kPa – a planning figure rather than a measured value.
Bottom line: plan long drives as segments with jacking stations.
Single Shift, Two Shifts or Continuous Operation
Treat a second shift as a capacity decision: two shifts lift output where spoil removal, slurry capacity and maintenance keep pace.
- Single shift – suits short drives and constrained sites; fixed start-up and end-of-shift work take a large share of the day.
- Two shifts – suits longer drives with a second crew and a maintained machine; production rises by well under 100 percent.
- Continuous operation – needs overnight spoil and slurry chains, plus noise and permit clearances many urban sites lack.
Maintenance is the limit on multi-shift working: cutters, pumps and seals wear faster around the clock, so planned stops become more frequent.
Our field teams treat pipe handling as the first item to attack when a drive is behind, because it repeats on every joint and is within the crew’s control.
Bottom line: decide the shift pattern from the spoil and maintenance plan.
Advance Rates in Rock and Mixed Face
What sets the operating limit? In soil, support and spoil handling; in rock, how long the cutting tools last.
Cutter wear is the dominant variable on a rock drive. Tool life depends on rock strength, abrasiveness and contact time at the face, and replacing worn tools underground is slow.
- Higher rock strength lowers penetration per revolution and raises cutter load.
- Abrasive ground accelerates cutter wear and shortens inspection intervals.
- Mixed face loads cutters unevenly; boulders cause impact damage and repeated stops.
A published review of 29 rock microtunneling cases found that rock drives advance more slowly and tool condition sets the pace.
Where a drive is mostly hard rock over a long length, it is often reviewed as a different machine class; see microtunneling in rock and mixed ground.
Bottom line: budget cutter wear as a schedule item as well as a cost item; on rock it drives the programme.
Turning an Advance Rate Into a Realistic Programme
A programme is built from four inputs, and a single microtunneling productivity figure will be wrong at both ends of the drive:
- Effective hours per shift after start-up, shift change and end-of-shift work are removed.
- Utilization – the share of those hours spent cutting.
- Cutting rate for the ground and diameter, and the cycle time for each pipe joint.
- Drive length in pipe joints, and the stops each one implies.
The working estimate is effective hours x utilization x cutting rate. Shaft construction and mobilisation are programmed separately, because one figure hides both.
State the denominator before comparing production figures: a rate quoted against paid shift hours reads lower than the same drive quoted against machine-on hours. Allow for downtime as a planning line. If a second shift is planned, check the spoil and slurry chains first, because they cap overnight output.
Where the rate has to be put next to a price, how much microtunneling costs per foot sets out the per-foot bands the same geometry produces.
Bottom line: build the programme from hours, utilization and cutting rate, then add shafts and mobilisation as separate lines.
Not sure what production your ground will allow? JSW engineers review your alignment, geotechnical report and shift plan, and benchmark the drive before bid.
Microtunneling Productivity and Advance Rate Reference Table
Every figure below is a published industry or case-study range for planning, seen through the conditions that set production per shift.
| Condition | Typical planning range | Main constraint |
|---|---|---|
| Firm clay and silt | Upper part of the 9-15 m per day band | Muck handling, cutterhead clogging |
| Loose sand and gravel, water controlled | Mid to lower part of the band | Face support, slurry capacity |
| Running or water-bearing sand | Lower and more variable | Face stability, settlement limits |
| Soft to medium rock | Reduced, driven by tool life | Tool life, penetration |
| Mixed face and boulder zones | Lowest and least predictable | Uneven tool loading, repeated stops |
| Long drives above about 300 m | Decays with drive length | Friction, jacking stations, thrust resets |
| 600-900 mm class without jacking stations | Drive limited to 160-200 m | Jacking force, pipe compressive capacity |
Read the table as a starting band, then adjust for ground, diameter, depth, shift pattern and site constraints.
Frequently Asked Questions
What is a realistic daily production rate?
On established soft-ground drives, plan about 9-15 m per day, matching the 30-50 linear feet per day reported in published municipal case studies. Treat it as a range, not a fixed output.
Why do theoretical rates never match the field?
Theoretical penetration assumes the machine cuts for the whole shift. In practice, pipe handling, survey, steering corrections and maintenance all consume time. The share of the shift left for cutting determines real output.
How much does cutter wear slow a rock drive?
Tool life depends on rock strength and abrasiveness, and worn tools must be replaced, usually slowly. A published review of 29 rock microtunneling cases found that rock drives advance more slowly and tool condition sets the pace.
Does working a second shift double the daily advance?
No. A second shift raises output only where spoil removal, slurry capacity and maintenance keep pace. Cutter, pump and seal wear also accelerate around the clock, so plan around the support systems.
What causes most microtunneling downtime?
Most lost time is the sum of short stoppages rather than one large failure. Cutter changes, slurry blockages, settlement-limit reviews and disposal constraints all remove cutting time.
When do you need intermediate jacking stations?
When jacking force approaches the capacity of the pipe or thrust system, which usually happens on long drives. Specifications commonly require allowance for a station roughly every 100 m, and 600-900 mm machines are typically limited to 160-200 m per drive without one.
How do you estimate a programme from a production rate?
Use effective hours in a shift, the share spent cutting, and the cutting rate for the ground and diameter, then apply the result to the drive length. Program shafts and mobilisation separately, and subtract every foreseeable stop.
Benchmarking Your Drive
Benchmarking starts with three numbers: the drive length, the ground at the face, and the shift pattern you can actually staff. From those you can set an expected band for microtunneling productivity and compare it against published ranges.
The same three numbers serve a tender programme and an owner’s promised date.
Then list every foreseeable stop, assign a realistic duration, and subtract it from the calendar; what remains is the cutting time.
Where the sequence of a drive still needs setting out, how microtunneling works step by step covers it, and microtunneling services and microtunneling construction services cover delivery. Contact our engineering team with your alignment data and we will benchmark the drive.
Get a second opinion at no cost. JSW plans and executes microtunneling crossings with its own crews and equipment. Send your alignment and ground data and we will compare your expected production against comparable drives.
Sources
The productivity, drive-length and jacking-station ranges in this guide follow these published industry standards and guidance documents:
- ASCE 36-15, Standard Design and Construction Guidelines for Microtunneling.
- ASTM D653, Standard Terminology Relating to Soil, Rock, and Contained Fluids.
- NASTT Good Practices Guidelines (Microtunneling).
- Herrenknecht microtunneling machine documentation.











 English
  Arabic
  Russian
  Spanish
  French
  Vietnamese
  Polish
  Thai
Thai  Indonesian
  Turkish
  Portuguese