Internal corrosion in subsea pipelines manifests through measurable production changes, inspection data anomalies, and physical indicators that include increased water cut, wall thickness loss detected by ultrasonic surveys, localized pitting in bends, and unexpected pressure or flow variations across the pipeline system.
The challenge of detecting internal corrosion lies in its hidden nature—corrosion progresses within the pipe wall while external coatings often remain intact. Pipeline operators, integrity engineers, and maintenance contractors must rely on a combination of direct inspection technologies, indirect monitoring methods, and operational data analysis to identify the early warning signs before failure occurs. This comprehensive guide examines the common indicators of internal corrosion, the advanced inspection technologies used for detection, and the engineering solutions available for restoration.
1. What Operational Parameters Indicate Potential Internal Corrosion?
Changes in day-to-day production data often provide the first indication that internal corrosion may be developing within a subsea pipeline. These operational signs require no invasive inspection and should trigger immediate investigation.
1.1 Increasing Water Cut and Its Correlation with Corrosion Risk
The single most significant predictor of internal corrosion risk is the water cut—the percentage of water produced alongside oil and gas. When water cut exceeds 20-30%, the produced fluids shift from oil-wetting to water-wetting conditions, breaking the protective oil film on the internal pipe surface -4.
Key indicators to monitor:
- Gradual increase in produced water percentage over 6-12 months
- Sudden step-changes following reservoir breakthrough
- Correlation between water cut increases and corrosion inhibitor dosage requirements
Field data correlation: A study of subsea pipeline corrosion in the Xijiang Oilfield demonstrated that increasing water content directly accelerated CO2 corrosion rates, with the most severe internal corrosion observed in sections where water accumulated due to flow regime changes.
1.2 Pressure and Flow Rate Anomalies
Internal corrosion changes the hydraulic characteristics of pipelines. As corrosion products build up or as wall thickness decreases, operators may observe:
- Increasing differential pressure at constant flow rates, indicating internal roughness changes or partial blockages from corrosion products
- Decreasing flow efficiency calculated from pressure drop versus theoretical values
- Unexpected pressure drops at specific flow rates that suggest localized flow acceleration through corroded sections
1.3 Fluid Composition Changes
Regular sampling of produced fluids reveals chemical indicators of active corrosion:
| Parameter | What It Indicates | Alert Threshold |
|---|---|---|
| Iron count | Active wall loss | >10 ppm increase from baseline |
| Manganese | Weld corrosion | Detection above trace levels |
| CO2 partial pressure | Corrosivity potential | >0.5 bar without inhibition |
| H2S concentration | Sulfide stress cracking risk | Any detectable increase |
2. How Do Inspection Technologies Reveal Internal Corrosion Signs?
Modern subsea inspection employs multiple non-destructive testing (NDT) technologies to detect and quantify internal corrosion. Each technology provides different perspectives on corrosion damage.
2.1 Ultrasonic Wall Thickness Measurements
Ultrasonic testing remains the gold standard for quantifying metal loss. Advanced systems now operate at depths exceeding 3000 meters.
Common ultrasonic inspection findings:
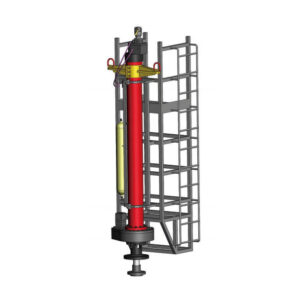
The PROVUS system, developed for ultra-deepwater applications, utilizes pulse-echo ultrasonic transducers that maintain accuracy at pressures up to 250 bar. When deployed, these systems reveal:
- General wall thinning: Uniform reduction across pipe sections, typically expressed as a corrosion rate in mm/year
- Localized pitting: Discrete deep pits that may penetrate the wall while surrounding areas remain near-nominal thickness
- Top-of-line corrosion: Thinning at the 12 o’clock position caused by water vapor condensation in wet gas lines
- Bottom-of-line corrosion: Preferential attack at the 6 o’clock position where water settles
Quantitative data requirements: Wall thickness measurements should achieve ±0.3 mm accuracy for defect depth to properly classify corrosion severity.
2.2 Corrosion Mapping with Phased Array Technology
Subsea Phased Array (SPA) technology produces high-resolution topographical maps of internal and external surfaces. The vCompact™ scanner, deployed by remotely operated vehicles (ROVs), demonstrates the capabilities of modern corrosion mapping:
Inspection parameters from field applications:
- Scanning coverage: 550 mm axial passes with 50 mm incremental steps for complete coverage
- Detection probability: >95% for defects ≥1 mm
- Sizing accuracy: ±0.5 mm for corrosion features
What corrosion maps show:
Corrosion mapping reveals the spatial distribution of metal loss. Experienced inspectors look for:
- Clustered pitting indicating under-deposit corrosion
- Longitudinally oriented grooves suggesting flow-assisted corrosion
- Circumferential patterns that may indicate weld heat-affected zone corrosion
- Preferential attack at specific clock positions relative to flow direction
2.3 In-Line Inspection (ILI) Data Interpretation
For piggable pipelines, intelligent pigging provides comprehensive internal corrosion data. However, ILI data requires careful interpretation:
Key corrosion indicators from ILI runs:
- Magnetic flux leakage (MFL) anomalies: Indicate metal loss but may underestimate depth in complex geometries
- Ultrasonic wall measurements: Provide actual remaining wall thickness but require liquid coupling
- Caliper runs: Reveal geometric changes caused by corrosion product buildup or wall deformation
Recent advances in Bayesian-based hybrid corrosion growth models enable operators to update corrosion predictions using limited ILI data, progressively reducing uncertainty with each inspection campaign.
3. Where Does Internal Corrosion Typically Occur in Pipeline Systems?
Understanding the preferential locations for internal corrosion helps inspectors target their efforts and operators focus monitoring resources.
3.1 Bend and Elbow Sections
Pipeline bends experience accelerated internal corrosion due to flow dynamics. The Xijiang Oilfield investigation revealed that corrosion products in bend sections exhibited mud-like consistency with cracking patterns, while straight sections showed more uniform corrosion product layers.
Why bends corrode faster:
Flow modeling and field failure analysis demonstrate that bends create:
- Liquid accumulation: Heavier water phase separates and collects at the outer radius
- Turbulent flow: Disrupted flow patterns increase wall shear stress
- Pressure gradients: Higher pressure at the outer radius can accelerate corrosion reactions
- Sand impact: Any entrained solids impact the outer wall, removing protective films
Case study evidence: A subsea pipeline bend that suffered perforation showed a corrosion hole measuring 34.46 mm × 27.23 mm located at the outer arc. Analysis confirmed the perforation initiated internally and progressed outward, driven by CO2 corrosion in the water phase that preferentially accumulated at the bend’s outer radius.
3.2 Low-Point Sections and Sagbends
Wherever pipelines dip below their nominal elevation, water accumulates. These low points become corrosion hot spots because:
- Water separates from hydrocarbon phases in low-velocity regions
- Solids (sand, scale, corrosion products) settle and create under-deposit corrosion cells
- Water washing removes corrosion inhibitor films
- Microbial communities establish in stagnant water
3.3 Dead Legs and Intermittently Operated Lines
Sections of pipeline that experience stagnant or intermittent flow present unique corrosion risks. In the Ormen Lange field development, sections identified as future dead legs were prioritized for baseline inspection due to susceptibility to:
- Flow-Assisted Corrosion (FAC) at the onset of dead legs where turbulence creates high shear stress
- Top-of-Line (TOL) corrosion from vapor condensation
- Bottom-of-Line (BOL) corrosion in liquid pools
- Loss of corrosion inhibitor effectiveness due to inadequate distribution
3.4 Weld Zones
Welds and their heat-affected zones often corrode preferentially due to:
- Metallurgical differences between weld metal and parent pipe
- Residual stresses creating galvanic cells
- Weld profile irregularities affecting flow patterns
- Preferential coating damage during field joint installation
4. What Physical Evidence Do Corrosion Coupons and Monitoring Devices Provide?
Direct physical evidence from corrosion monitoring devices installed on operating pipelines provides invaluable data about corrosion mechanisms and rates.
4.1 Corrosion Coupon Analysis
Corrosion coupons—pre-weighed metal strips exposed to the production stream—provide the most direct measurement of corrosivity. When retrieved and analyzed according to standards such as NACE SP0775, coupons reveal:
Macroscopic observations:
- Uniform corrosion distribution versus localized pitting
- Preferential attack at edges or surfaces
- Deposit accumulation patterns
- Under-deposit corrosion features
Microscopic analysis:
SEM and EDS analysis of coupon surfaces reveals corrosion product composition. For the Xijiang pipelines, analysis showed corrosion products were relatively疏松 in straight sections but cracked and mud-like in transition zones.
Quantitative measurements:
- Weight loss converted to average corrosion rate (mm/year)
- Maximum pit depth measured microscopically
- Pit density and distribution statistics
4.2 Electrical Resistance and Linear Polarization Resistance Probes
Online corrosion probes provide real-time or semi-real-time corrosion rate data:
ER probe data interpretation:
- Steady metal loss indicates uniform corrosion
- Step changes suggest process upsets or inhibitor upsets
- Accelerating rates may indicate inhibitor depletion or environmental change
LPR probe applications:
These probes measure instantaneous corrosion rates but require conductive electrolytes—they work best in water-continuous systems and may under-report corrosion in oil-wet conditions.
4.3 Sand and Solids Monitoring
Erosion-corrosion synergies accelerate damage where sand production occurs. Sand probes detect particle impacts, and increasing sand production should trigger:
- Enhanced inspection of bend sections
- Review of flow velocities
- Evaluation of sand management strategies
- Correlation with any sudden changes in corrosion rates
5. How Do Chemical Analysis Results Confirm Internal Corrosion?
Produced water chemistry provides ongoing evidence of corrosion activity and helps operators understand corrosion mechanisms.
5.1 Iron Counts and Trend Analysis
Dissolved iron in produced water directly indicates active steel corrosion. Effective iron monitoring requires:
Baseline establishment:
Operators must establish normal iron levels for each field, accounting for:
- Natural formation water iron content
- Reservoir temperature effects
- pH and bicarbonate buffering
- Iron sulfide versus iron carbonate solubility
Trend interpretation:
- Gradual increases suggest accelerating general corrosion
- Spikes indicate localized corrosion events or inhibitor upsets
- Declining trends with constant corrosivity may indicate protective scale formation
5.2 Manganese and Chromium Detection
The presence of alloying elements in produced water indicates specific corrosion mechanisms:
- Manganese: Detected when weld metal corrodes preferentially
- Chromium: Suggests corrosion of stainless steel components or cladding
- Nickel: May indicate corrosion of corrosion-resistant alloys
5.3 Microbiological Analysis
Microbiologically influenced corrosion (MIC) produces distinct chemical signatures:
- Sulfate-reducing bacteria (SRB): Produce H2S, detected by sulfide in water samples
- Acid-producing bacteria (APB): Lower pH locally under biofilms
- Iron-oxidizing bacteria: Produce iron oxide deposits and tubercles
Sampling protocols: Accurate MIC assessment requires specialized sampling techniques that preserve the biological community structure. The establishment of microbial gene databases for subsea pipelines enables operators to identify MIC risk through DNA analysis of pigging debris or coupon deposits.
6. What Advanced NDT Technologies Provide Definitive Corrosion Evidence?
When screening methods indicate potential corrosion, advanced NDT techniques provide definitive quantification.
6.1 Time-of-Flight Diffraction (ToFD)
ToFD provides precise sizing of planar defects including cracks and lack-of-fusion in welds. For corrosion assessment:
- Applications: Sizing stress corrosion cracks, assessing weld integrity in corroded areas
- Accuracy: ±0.5 mm defect sizing
- Advantages: Not dependent on defect orientation, provides permanent record
6.2 Acoustic Resonance Technology (ART)
ARTEMIS technology enables through-coating inspection without coating removal, providing:
- Full 360° circumferential coverage per placement
- 700 mm axial coverage per scan
- Operation through coatings up to 7.7 mm thick
- No requirement for direct steel contact
Field application: For the Ormen Lange field, ARTEMIS successfully inspected pipelines from 16 to 35 inches diameter through FBE and polypropylene coatings, establishing baseline wall thickness profiles for dead leg sections.
6.3 Computed Tomography and Radiography
While less common for routine inspection due to safety considerations, CT and X-ray methods provide:
- Volumetric visualization of corrosion features
- Through-coating capability
- Detection of internal features not accessible by ultrasound
- Validation data for other inspection methods
7. How Do Contractors and Service Companies Address Internal Corrosion?
The subsea pipeline industry has developed a comprehensive service infrastructure to detect, assess, and repair internal corrosion damage.
7.1 Inspection Service Providers
Specialized contractors offer ROV-deployable inspection solutions:
Typical service scope:
- Mobilization of NDT technicians and robotic engineers
- Equipment calibration and validation
- ROV integration and offshore deployment
- Real-time data analysis and reporting
- Integrity assessment recommendations
Operational metrics: For a recent South China Sea campaign, a team of two NDT technicians and two robotic engineers worked 12-hour shifts to maintain continuous operations, achieving nearly 30% faster inspection than diver-based alternatives.
7.2 Engineering and Integrity Assessment
Engineering contractors provide:
- Corrosion growth modeling using Bayesian inference methods
- Remaining life calculations
- Risk-based inspection planning
- Fitness-for-service assessments
Recent advances in corrosion modeling enable iterative updating of corrosion predictions using limited ILI data. A Bayesian-based hybrid corrosion growth model combined with heuristic genetic algorithms achieved a 38.83% reduction in total maintenance cost while maintaining system reliability.
7.3 Maintenance and Restoration Services
When corrosion damage requires intervention, contractors offer:
- Pipeline modification: Cutting out and replacing corroded sections
- Hot tapping: Adding branches without interrupting service
- Pipeline plugging: Isolating sections for repair
- Trenchless pipe rehabilitation: Internal lining or sleeve installation
- Stopple applications: Temporary flow diversion for permanent repairs
7.4 Material Suppliers and Equipment Manufacturers
The supply chain supporting corrosion management includes:
- Pipe and fitting suppliers: Providing replacement materials with appropriate corrosion allowance
- Coating applicators: Applying internal and external coatings
- Corrosion inhibitor manufacturers: Supplying chemicals for ongoing protection
- NDT equipment manufacturers: Producing ultrasonic transducers, scanners, and data acquisition systems
8. What Does a Comprehensive Corrosion Assessment Report Include?
The final product of any corrosion investigation should be a report that enables informed decision-making.
8.1 Required Data Elements
Inspection results tabulation:
- Location of each inspection point (KP, GPS coordinates, depth)
- Measured wall thickness (minimum, average, maximum)
- Defect dimensions (length, width, depth)
- Defect orientation and clock position
- Inspection method and accuracy
Corrosion rate calculations:
- Short-term rate since last inspection
- Long-term average rate
- Maximum pit penetration rate
- Remaining life estimates at current rates
8.2 Integrity Assessment
The assessment should answer:
- Does the pipeline meet design code requirements for current operation?
- What is the maximum allowable operating pressure considering corrosion damage?
- When should the next inspection occur?
- What mitigation measures are recommended?
8.3 Actionable Recommendations
Effective reports provide clear guidance:
- Immediate actions: Pressure reduction, repair scheduling, inhibitor optimization
- Near-term actions: Enhanced monitoring, targeted inspection, cleaning pigging
- Long-term planning: Replacement timing, corrosion control strategy updates
Conclusion: Integrating Corrosion Signs into Proactive Management
The signs of internal corrosion in subsea pipelines range from subtle operational changes to definitive physical evidence from inspection technologies. Successful integrity management requires integrating multiple data sources:
- Operational data provides early warning and ongoing surveillance
- Inspection data quantifies damage and validates models
- Monitoring data tracks real-time corrosion rates
- Chemical data confirms mechanisms and inhibitor performance
- Maintenance records document intervention effectiveness
For operators facing corrosion challenges, engaging experienced contractors and service providers ensures access to the full range of inspection technologies, engineering expertise, and restoration capabilities. Whether planning routine inspections, investigating suspected corrosion, or executing repairs, the combination of advanced technology and specialized experience delivers the confidence needed to operate subsea pipelines safely and efficiently.
Author: Senior Integrity Engineer, Pipeline Solutions Team
Updated: March 2026
JSW Brand Profile and Capabilities
JSW is a leading provider of comprehensive pipeline solutions, specializing in the full lifecycle management of subsea and onshore pipeline systems. Our integrated approach combines engineering expertise, advanced manufacturing capabilities, and field services to address the most challenging pipeline integrity issues.
Our Pipeline Solutions Portfolio:
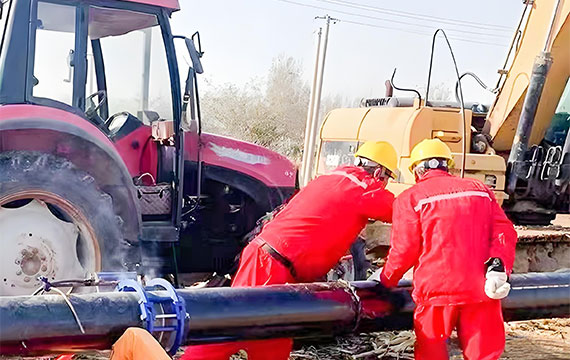
- Hot Tapping & Line Stopping: Our experienced teams execute pressurized connections and isolations without system shutdown, maintaining production while addressing corrosion damage. JSW hot tapping services accommodate line sizes from 2″ to 60″ at pressures up to ANSI 2500.
- Pipeline Repair & Modification: When corrosion requires intervention, our engineering team designs permanent repair solutions including composite wraps, steel sleeves, and section replacements. We mobilize rapidly with all necessary equipment and certified technicians.
- Trenchless Pipeline Rehabilitation: For pipelines requiring internal restoration, our trenchless rehabilitation services install cured-in-place liners and close-fit linings that restore structural integrity while improving flow characteristics.
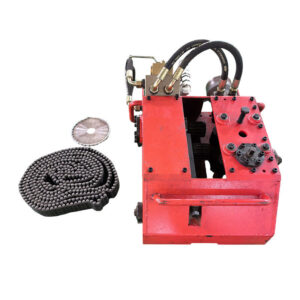
- Pipeline Plugging & Isolation: JSW supplies high-integrity pipeline plugging systems for temporary or permanent isolation. Our stopple® equipment and pipeline tapping machines enable safe isolation for inspection, repair, or modification.
- Construction Services: From new installation to integrity upgrades, our construction teams deliver quality workmanship in the most challenging environments. We manage everything from coating application to tie-in connections.
- Maintenance & Restoration: Our ongoing maintenance programs combine inspection data review, corrosion engineering assessment, and scheduled intervention to extend asset life and prevent unplanned outages.
Why Choose JSW:
- Integrated Capability: Unlike contractors who only inspect or manufacturers who only supply equipment, JSW delivers complete solutions—from initial detection through final restoration.
- Engineering-Led Approach: Every JSW project is supported by professional engineers who understand corrosion mechanisms, materials behavior, and pipeline mechanics.
- Proven Track Record: We have successfully completed thousands of hot taps, repairs, and integrity projects worldwide, including deepwater, Arctic, and high-temperature applications.
- Manufacturing Backbone: As an equipment manufacturer, we control the quality and availability of critical components including pipeline plugs, tapping machines, and repair fittings.
- Responsive Service: Our global network of service centers ensures rapid mobilization of equipment and personnel when corrosion issues demand immediate attention.
Contact JSW today to discuss your subsea pipeline corrosion challenges. Our team is ready to develop cost-effective solutions that restore integrity, extend service life, and maintain production.